Dynamic Reference Lines in Tableau Using Parameters:
In Tableau, a reference line provides a point, line, or area to compare values in a visualization. It can be based on a constant, a calculated field, or an aggregated measure such as average, median, or total, making it useful for analysis and comparison.
Last time, we explored parameters; now, let’s see how they bring interactivity to reference lines.
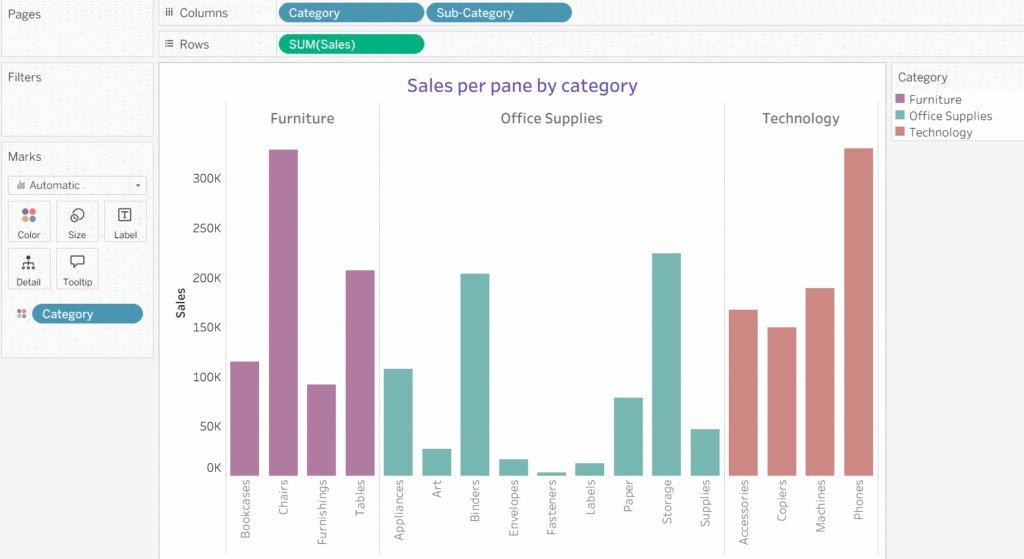
To start with a reference line, first we need a worksheet. So I have created a worksheet by placing category and sub-category into the columns and sales into the rows.
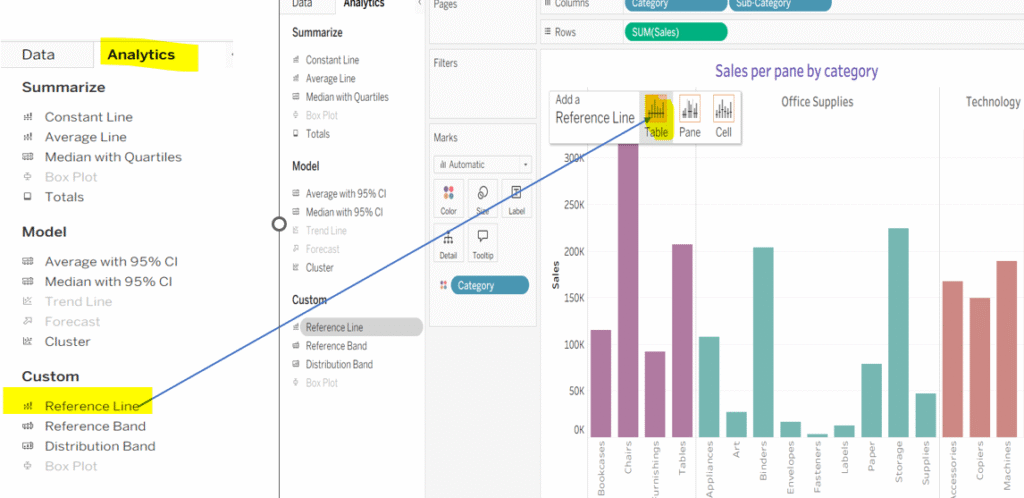
Step 1: Go to the Analytics Pane and drag the reference line on to the view, here, you will see 3 options, select Table option.
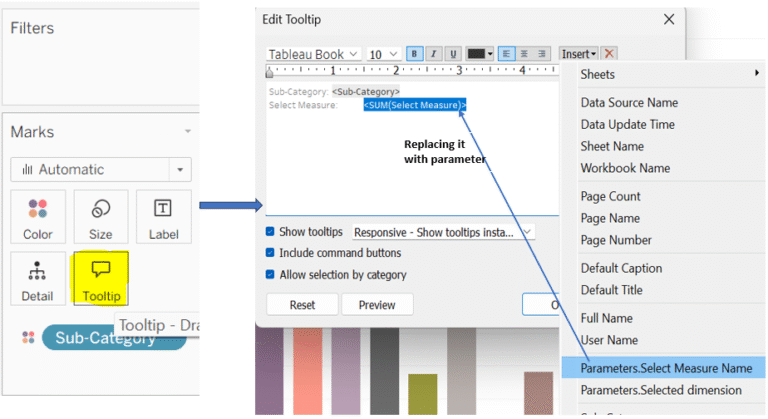
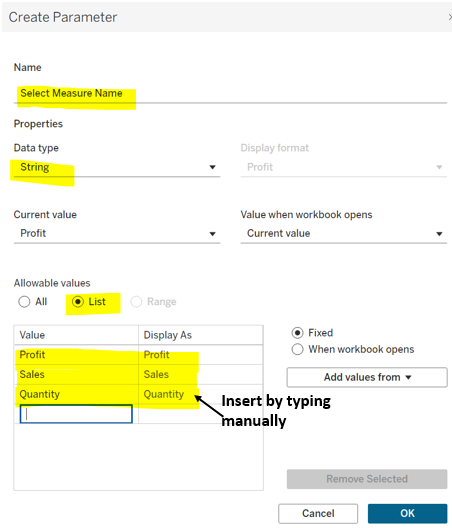
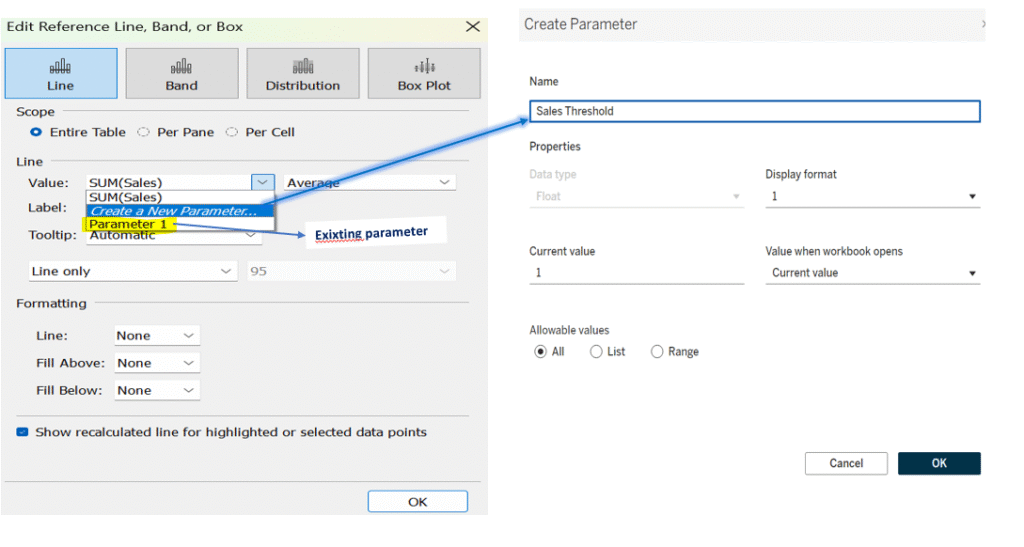
Step 2: Once you select the Table option, a window will appear, you will see your measure, existing parameters, and the ‘Create Parameter’ options. Here, you can use an existing parameter, but today we will learn how to create a new one on the spot. Click on ‘Create Parameter’ and enter your parameter details and click ok.
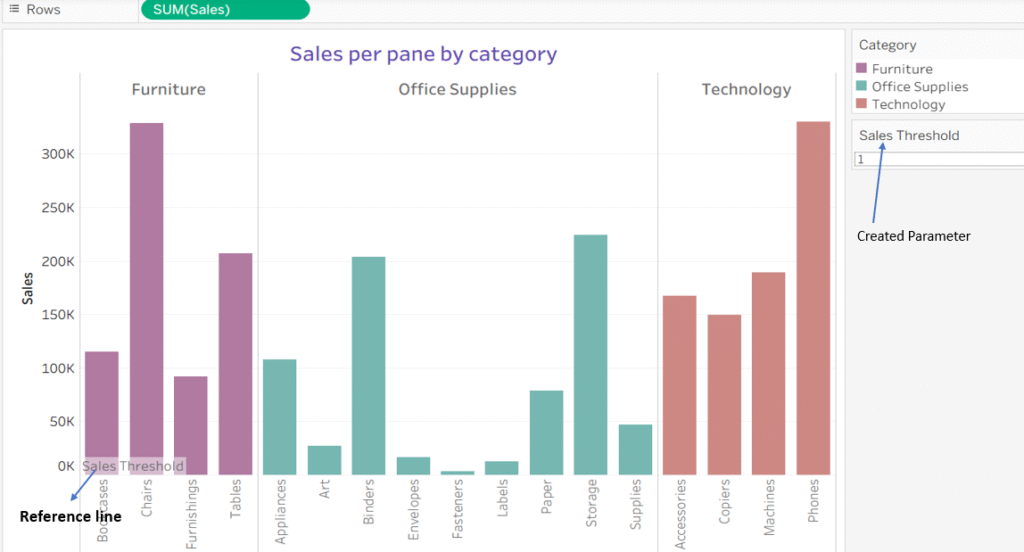
Step 3: Once the parameter is created, you will notice that it appears on the right side of your view, and a reference line in your viz.
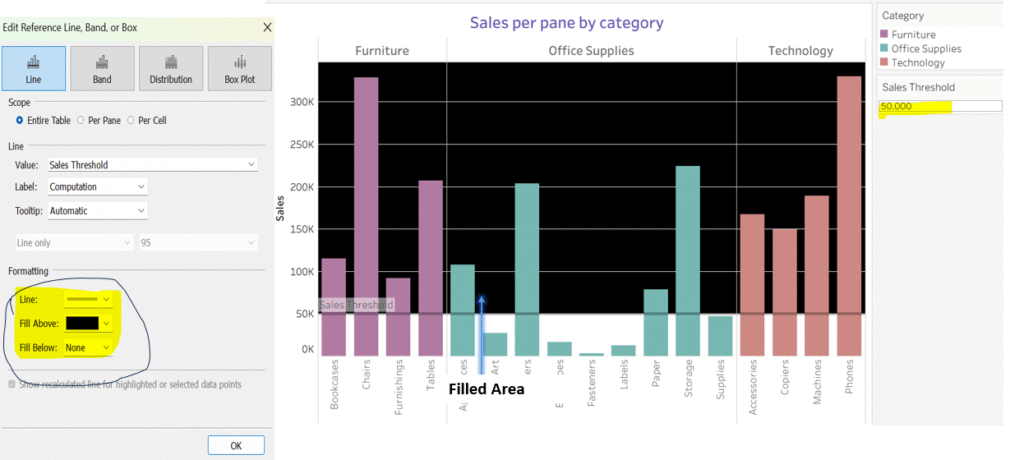
Step 4: You can format the reference line by increasing its width or filling the area above or below it. To do this, access the Format menu of reference line (by right clicking on the line) in your view where you can make these edits.
Thanks for supporting!
Keep Learning.