Mastering Parameter in Calculated Fields in Tableau:
Parameter in Tableau can be a number, string, date, or boolean value that replaces a constant. It gives users the ability to change the value and retrieve data accordingly.
You do not need to create a separate sheet for visualizing different datasets. Instead, by using a parameter, you can simply enter a value into the parameter and instantly view the corresponding data.
Use cases of parameter: Parameter can be used in so many different ways:
- In Calculated Fields
- In Reference Lines
- In Filters
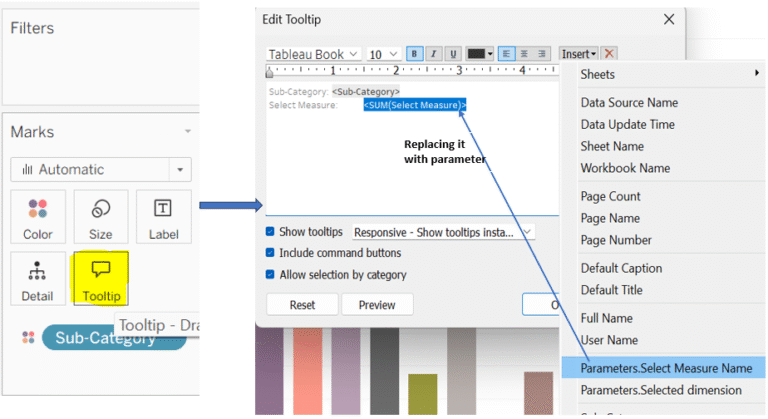
- In Swapping Measures and Dimensions
- In Dynamic Titles and Text
Types of parameters:
- Float: It includes decimal values for exact output.
- Integer: It is useful for count, sales and uses whole numbers.
- String: It allows users to enter text data like region and category name.
- Date: It allows users to enter the date.
- Date and Time: This allows date and time also.
- Boolean: It works only on true and false.
Let us go further and try to understand, what are the steps to be taken to create a parameter and how we use it in a calculated field:
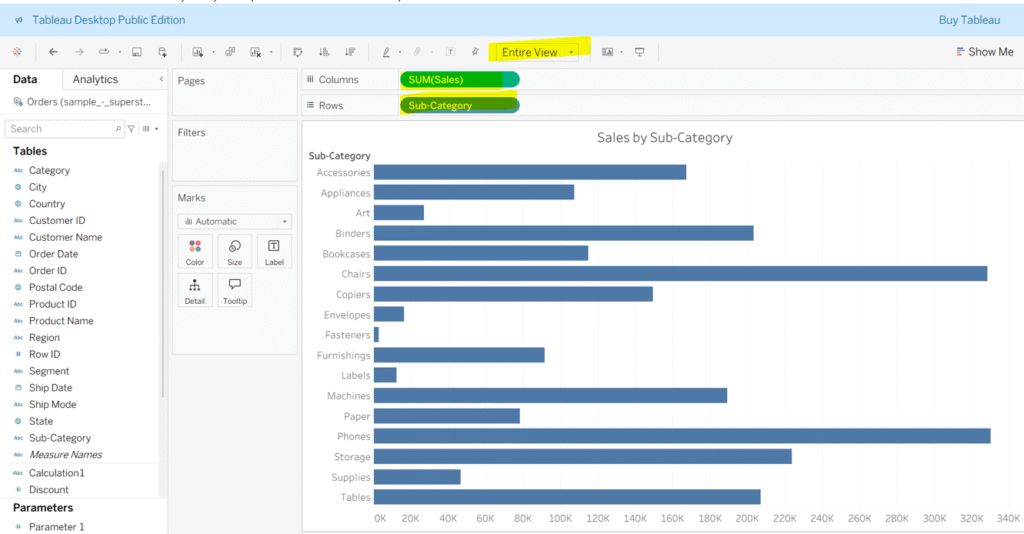
Step 1: Put sales into the columns and sub-category into the rows, and to make it cover the whole sheet, go to Fit and choose the entire view from the dropdown .
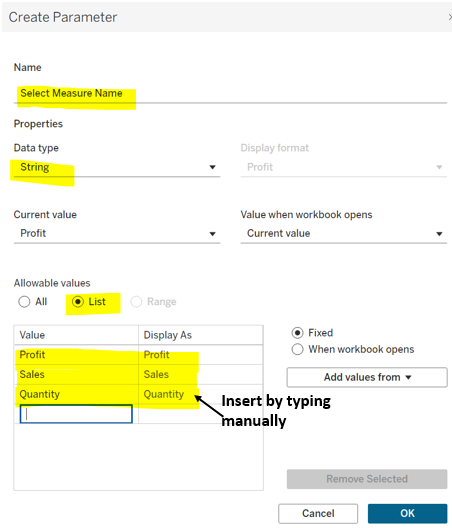
Step 2: To create parameter click on the dropdown in the data pane and choose the ‘Create Parameter’ option, enter the necessary data like name, data type and current value, and an allowable value option.

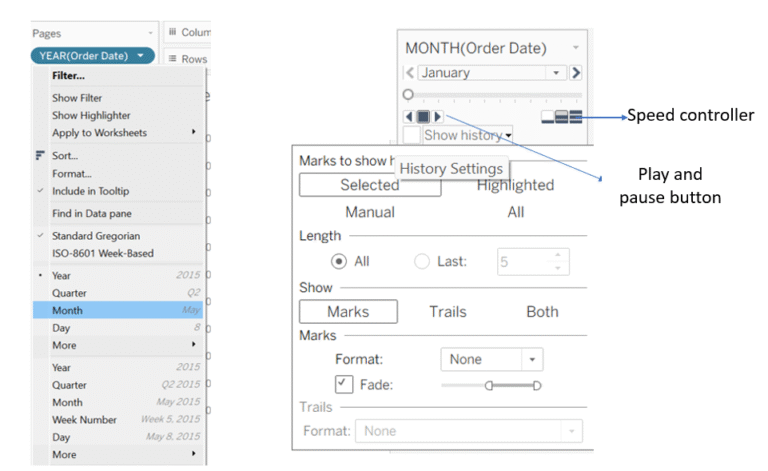
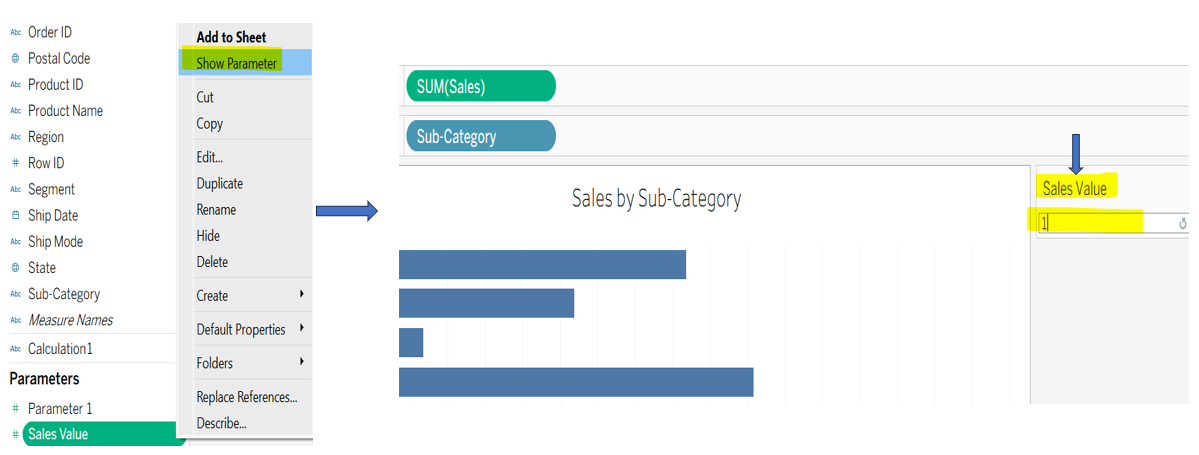
Step 3: After clicking OK, the parameter will appear at the bottom of the data pane. Click its dropdown menu and select “Show Parameter”. The parameter control will then appear at the top right of your worksheet.
Note: This parameter only works when you wire or join it with a calculated field, where you create the logic to change a view with the help of parameters.
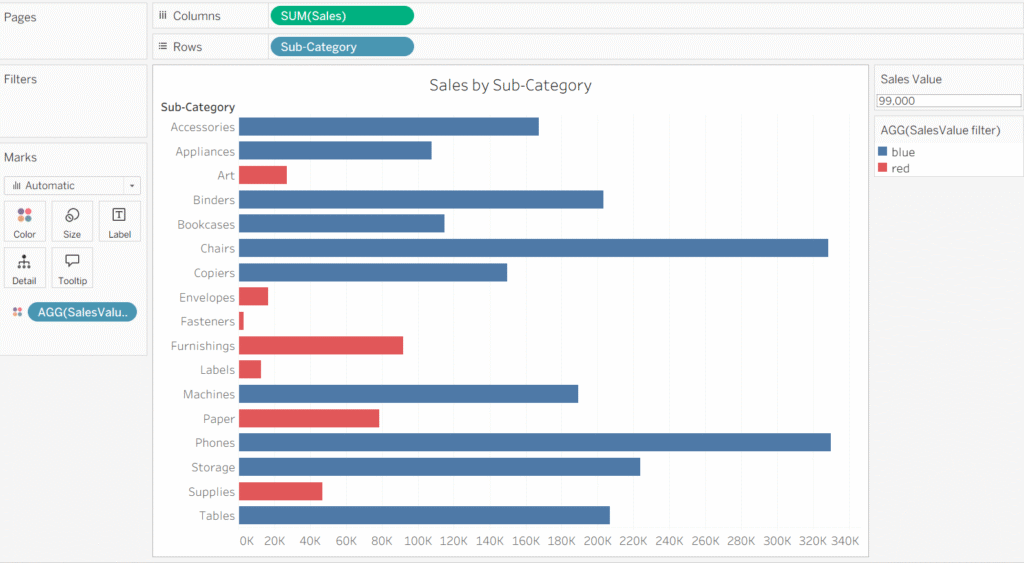
Step 4: Create a calculated field and define the logic by utilizing the parameter you created. Finally, drag the calculated field to the color shelf on the marks card. Now, when you enter any value into the parameter, your data will update accordingly. Here, I have highlighted the subcategories in red that have sales of less than 90,000.

Here is the output:
Thanks for supporting me!
Keep learning.