Mastering Measure Names & Values in Tableau:
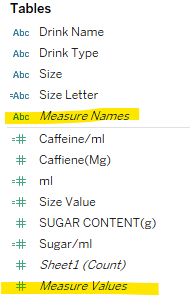
Measure Names can be thought of as a dimension that holds the names of all the quantitative fields (measures) in your dataset. Essentially, it acts like a header that allows Tableau to identify and display which measures are being used.
On the other hand, Measure Values are the actual numerical values for the Measure Names.
How Measure Values and Measure Names Work in Tableau:
In this example, I am trying to display Profit, Quantity, and Sales based on Segment. First, I place Segment on the Rows shelf. However, when I add multiple measures to the view, they appear stacked one on top of the other, without indicating which row corresponds to which measure. We can fix this with the following steps:
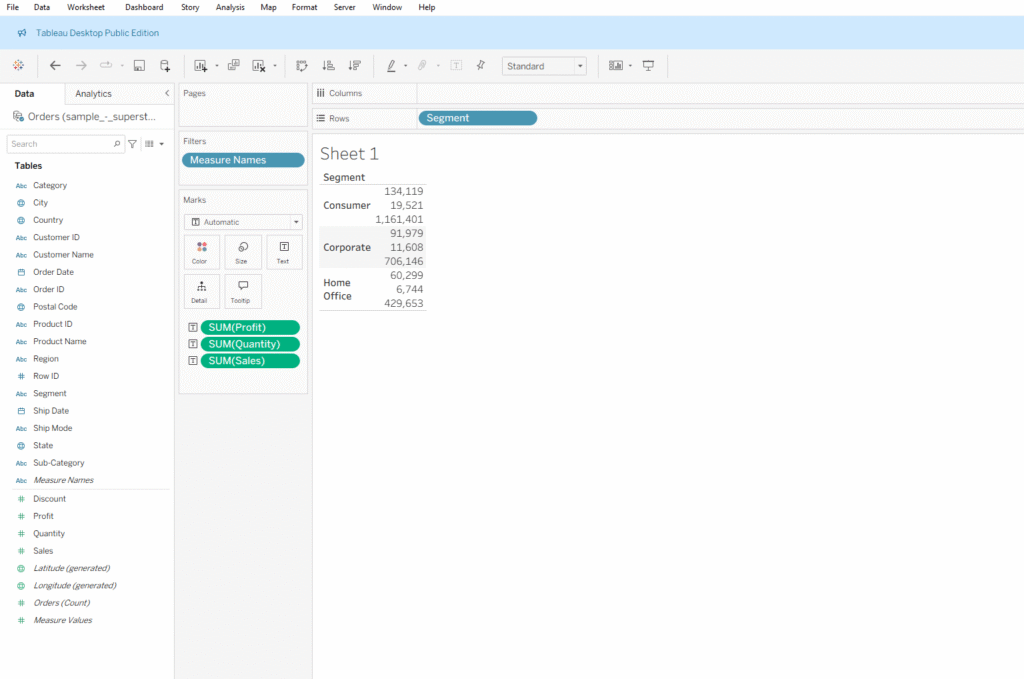
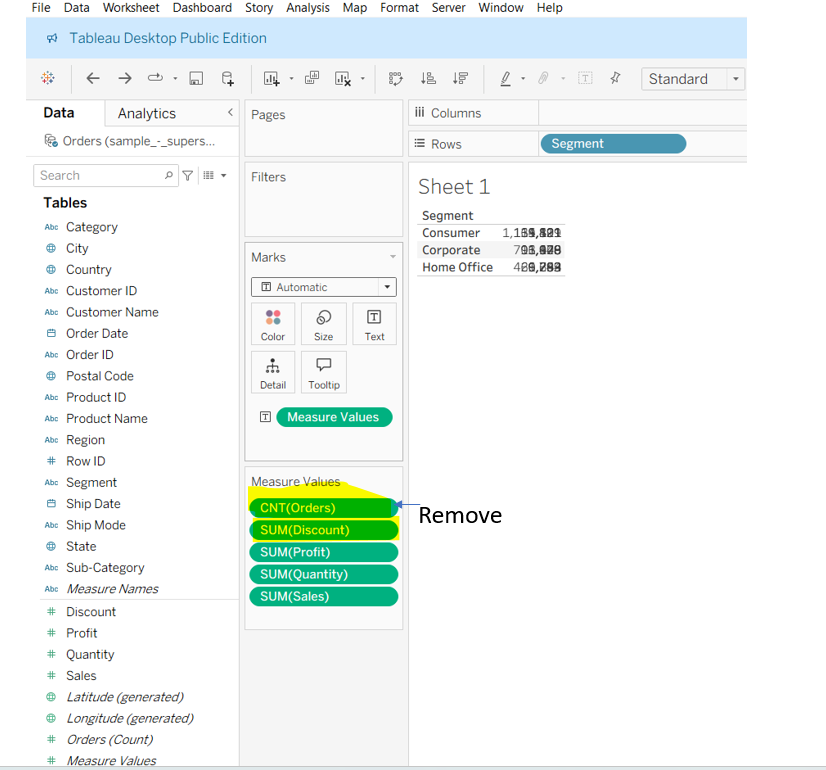
Step 1: To make Measure Names visible and display them in separate columns, double-click on Measure Values or drag it to the Text shelf in the Marks card. You will notice all the measure values are stacked on top of each other. Remove the measures you don’t need from the Measure Values list.
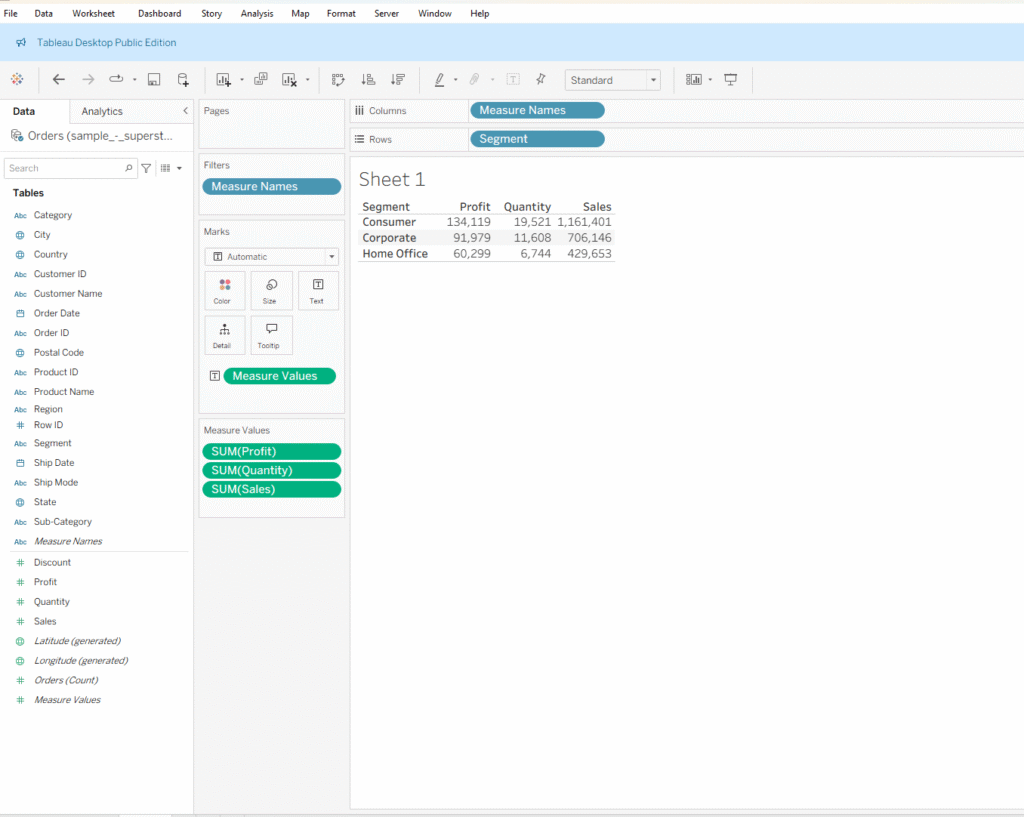
Step 2: Once you remove the unwanted measures, Measure Names will automatically appear in the Filters pane. Then, hold the Ctrl key and drag Measure Names (this makes copies the field) to the Columns shelf.
How Measure Values and Measure Names Work with Colors:
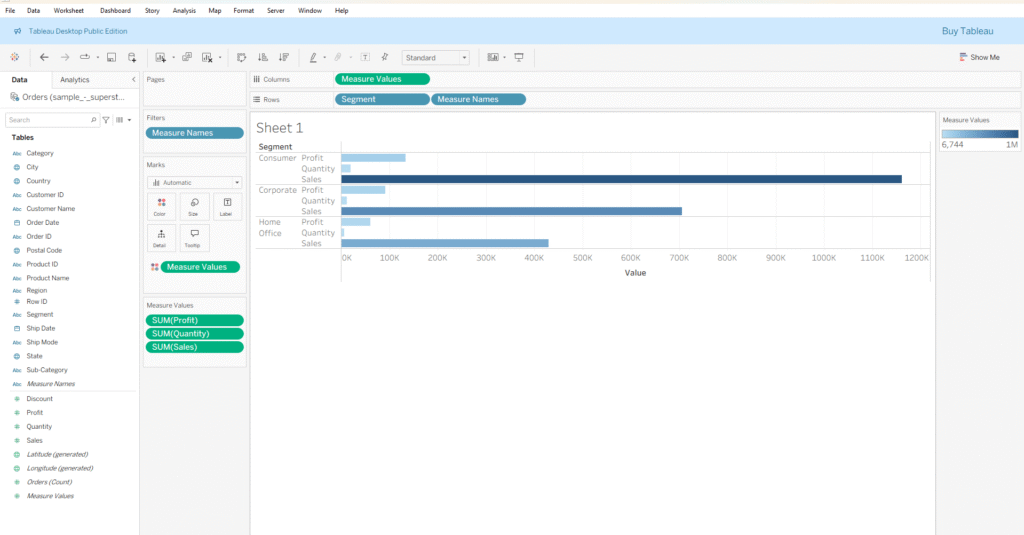
● In this example, when I drag Measure Values from the Columns shelf to the Color option in the Marks card while holding the Ctrl key, Tableau generates a view that applies a gradient color based on the combined values of all measures, such as Profit, Sales, and Quantity.
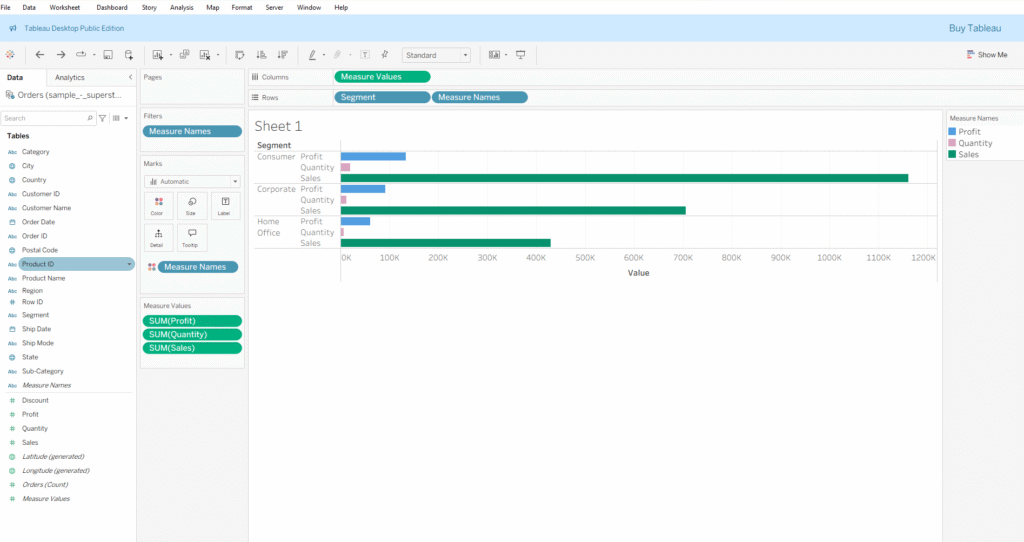
● However, when I drag Measure Names from the Filters shelf while holding the Ctrl key and place it on Color in the Marks card, you will notice that Tableau considers it as a dimension and assigns a different color to each measure name.
Thanks for stopping by!
Keep learning……